TL;DR:
- Embedded analytics integrates data insights directly into operational applications, enabling real-time decisions at the point of work. Successful implementation requires governed, clean data architecture, clear decision ownership, and strong executive sponsorship to drive adoption. Measurement focuses on behavioral changes, such as decision speed and operational improvements, rather than dashboard usage alone.
Embedded analytics is defined as the integration of data insights, dashboards, and AI-driven intelligence directly into the operational applications where work actually happens, such as CRMs, ERPs, and supply chain platforms. Unlike standalone business intelligence tools that require users to leave their workflow to consult a separate reporting environment, embedded analytics delivers context-specific data at the point of decision. Despite 90.5% of Fortune 1000 firms prioritizing data and AI, fewer than 24% have built a genuinely data-driven culture. The gap between intent and execution is where embedding analytics into business processes becomes the defining capability.
What embedding analytics into business processes actually requires
The foundation is not a dashboard. It is a governed, connected data architecture that feeds reliable metrics into the systems your teams already use every day.
Data sources and technology stack
Start by mapping every relevant data source: internal systems like Salesforce CRM, SAP ERP, and Google Analytics, as well as external feeds such as market pricing or supplier data. Organizations are moving from standalone BI to embedded analytics delivered via iframes, SDKs, or component libraries like React and Vue. Each approach carries trade-offs.
| Method | Best for | Key limitation |
|---|---|---|
| iFrame embedding | Fast deployment, low dev effort | Limited interactivity, styling constraints |
| SDK / API integration | Deep customization, native UX | Higher engineering investment |
| React / Vue components | Modern SaaS apps, component reuse | Requires front-end expertise |
The right choice depends on your existing tech stack and the level of interactivity your users need. A sales operations team embedding pipeline analytics into Salesforce will have different requirements than a finance team embedding variance reports into NetSuite.
Semantic layers, governance, and AI
Clean data is not optional. A semantic layer, which translates raw database fields into business-friendly metrics like “gross margin” or “churn rate,” creates consistency across every embedded view. Without it, two dashboards in the same organization can report different revenue figures, and that destroys trust faster than any technical failure.
Generative BI expands usability by enabling natural language queries, so a regional sales manager can ask “Which accounts are at risk this quarter?” without writing SQL. This widens adoption beyond analysts to the operational users who most need the insight.
Pro Tip: Architect your AI and ML models from day one rather than retrofitting them later. Models added after deployment often lack the training data context needed for accurate predictions, and rebuilding them mid-production is costly.
Organizational readiness matters as much as the technology. Executive sponsorship, a cross-functional data team, and clear ownership of decisions tied to analytics outputs are prerequisites, not afterthoughts.
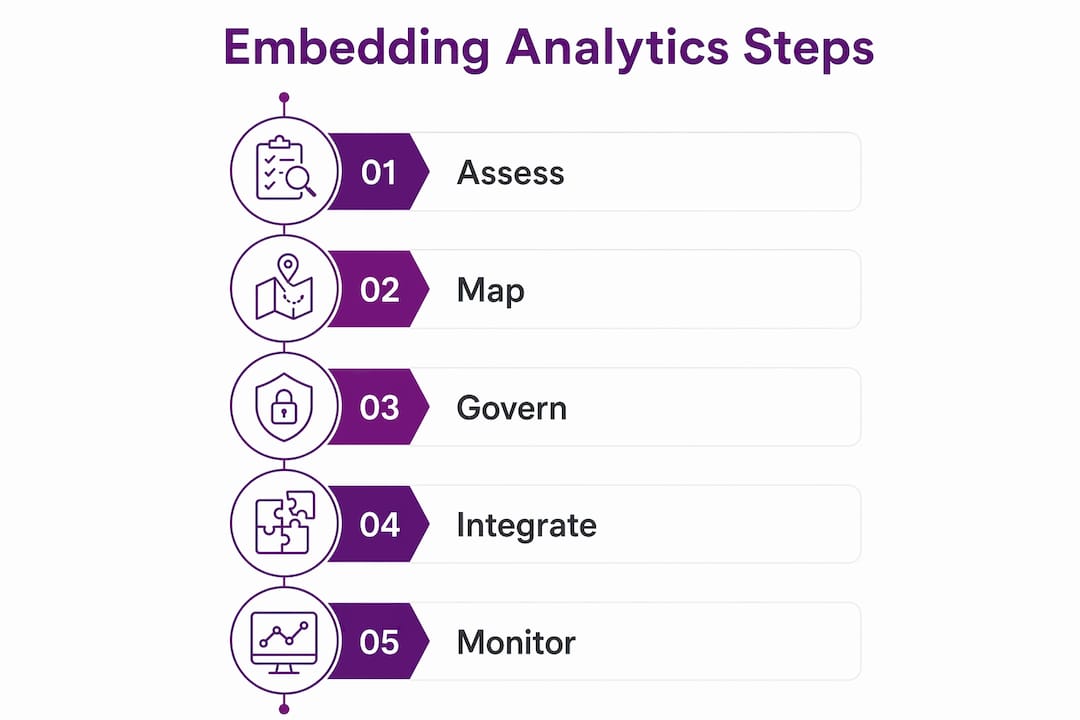
How to implement embedded analytics step by step
A structured six-step framework defines the implementation path: define the problem, identify data sources, clean data, analyze and visualize, decide and document, then iterate. Skipping any step weakens the final output and reduces decision quality.
- Define the problem. Identify one specific decision that analytics should improve. For example: “We want to reduce inventory stockouts by giving warehouse managers real-time reorder signals inside our ERP.”
- Identify data sources. Map which systems hold the relevant data. Inventory levels may live in SAP, demand forecasts in a planning tool, and supplier lead times in a spreadsheet.
- Clean and govern the data. Resolve duplicates, enforce naming conventions, and establish a data owner for each source. This step is where most projects stall.
- Analyze and visualize. Build the embedded view inside the target application. Prioritize signal over decoration. A single KPI card with a trend line often outperforms a 12-chart dashboard.
- Decide and document. Assign ownership for every alerted insight. Who acts when inventory drops below threshold? Document the decision rule so the process is repeatable.
- Iterate. Measure whether the embedded analytics changed behavior and improved the outcome. Adjust the model, the threshold, or the visualization based on user feedback.
| Business function | Embedded analytics use case | Decision accelerated |
|---|---|---|
| Sales | Pipeline health scores in Salesforce | Forecast accuracy and rep coaching |
| Operations | Real-time inventory alerts in ERP | Reorder timing and supplier selection |
| Finance | Variance dashboards in NetSuite | Budget reallocation speed |
| Marketing | Campaign ROI in HubSpot | Spend reallocation across channels |
Embedding analytics in daily workflows drives adoption precisely because it removes the friction of context switching. When a finance analyst does not need to open a separate BI tool to check budget variance, they check it more often and act on it faster.
Pro Tip: Mid-market companies typically outgrow ERP-native reporting within 24 months. If your teams are exporting data to Excel for analysis, that is a signal your embedded analytics foundation needs dedicated BI tooling.
What are common pitfalls when embedding analytics in operations?
Most analytics projects fail not because of poor visualization but because of governance and permission failures. Row-level security failures in multi-tenant environments can expose one customer’s data to another. This is a fatal outcome in regulated industries like healthcare and financial services.
The organizational pitfalls are equally serious:
- Siloed data. Analytics embedded in finance that cannot see HR or operations data produces incomplete pictures. Integrating disparate functional data across finance, HR, and operations is where competitive advantage actually lives.
- No decision ownership. Deploying a dashboard without assigning who acts on each alert creates a system that generates insight but no action.
- Skipping governance. Embedding analytics without a semantic layer or data catalog leads to metric inconsistency that erodes user trust over time.
- Underestimating change management. Technology accounts for roughly 30% of success; the remaining 70% depends on executive sponsorship, governance structures, and cultural adoption.
Security architecture deserves specific attention. Production-grade embedding requires deterministic tenant scoping, signed token authentication, audit logs, and compliance alignment to standards like SOC 2 or HIPAA. These are not optional enhancements. They are table stakes for enterprise deployment.
How do you measure success after deploying embedded analytics?
The primary signal is behavioral change, not dashboard usage. Are decisions that previously took days now taking minutes? Real-time analytics shifts decision speed from days to minutes, and that compression is measurable in operational KPIs.
Track these indicators post-deployment:
- Decision latency: How long does it take from data signal to documented decision? Baseline this before deployment and measure the reduction.
- Analyst bottleneck reduction: Self-service analytics capabilities, enabled by natural language query tools and well-governed semantic layers, reduce the volume of ad hoc data requests to your analytics team.
- Outcome KPIs: Revenue impact, operational efficiency gains, and customer satisfaction scores tied directly to the decisions your embedded analytics supports.
AI-driven alerting and prescriptive analytics close the loop between insight and action. Rather than waiting for a user to notice a trend, the system surfaces the alert, recommends an action, and logs the outcome. This is the difference between analytics as a reporting function and analytics as a strategic capability. The goal is a continuous feedback loop: measure, adjust, and repeat, with each iteration tightening the connection between data and business outcomes.
Key takeaways
Embedding analytics into business processes succeeds when governed data, clear decision ownership, and executive sponsorship are in place before the first dashboard goes live.
| Point | Details |
|---|---|
| Start with governance | A semantic layer and clean data architecture must precede any embedding effort. |
| Use the six-step framework | Define, source, clean, visualize, decide, and iterate to avoid skipped steps that degrade output quality. |
| Address the 70% factor | Executive sponsorship and cultural adoption drive more success than technology choices alone. |
| Secure multi-tenant environments | Row-level security, signed tokens, and audit logs are non-negotiable for enterprise deployments. |
| Measure behavioral change | Track decision latency and analyst bottleneck reduction, not just dashboard view counts. |
Why embedding analytics is a leadership initiative, not an IT project
From my experience working across industries, the organizations that get the most from embedded analytics share one trait: their leadership treats it as a strategic asset, not a technology checkbox. The CIO who sponsors the initiative and the CFO who ties budget decisions to embedded variance reports are the real drivers of adoption. The technology is the vehicle. The culture is the engine.
I have seen well-funded analytics programs stall because no one owned the decision that the data was supposed to inform. A beautiful dashboard embedded in Salesforce means nothing if the sales leadership team has not agreed on what “at-risk account” means or who calls the customer when the score drops. That alignment is a leadership conversation, not a data engineering task.
The evolving role of AI in this space is genuinely exciting, but I would caution against treating generative BI as a shortcut to organizational readiness. Natural language queries are powerful when the underlying data is governed and trusted. When the data is messy, AI surfaces messy answers faster. The foundation still has to be built correctly. Leaders should aim to be data-informed rather than purely data-driven, using analytics to guide judgment rather than replace it. That distinction matters more as AI-generated insights become more prevalent.
How Edgematics can help you embed analytics that drive decisions?
Edgematics works with organizations across healthcare, finance, and operations to build the data foundations that make embedded analytics production-ready. From data strategy development that aligns analytics integration with your business goals, to data engineering and governance that delivers clean, trusted data at scale, Edgematics provides end-to-end capabilities rather than point solutions. Their AI and ML practice ensures that predictive and prescriptive analytics are architected from day one, not retrofitted after deployment. If you are evaluating where your organization stands, Edgematics offers tailored maturity assessments to identify gaps and prioritize the highest-impact embedding opportunities for your specific operational context.
FAQ
What is embedded analytics?
Embedded analytics is the integration of data insights, dashboards, and AI-driven intelligence directly into operational applications like CRMs and ERPs, enabling decisions at the point of work without switching to a separate BI tool.
How does embedded analytics differ from traditional BI tools?
Traditional BI tools require users to leave their workflow to access a reporting environment. Embedded analytics delivers context-specific insights inside the applications teams already use, which drives higher adoption and faster decisions.
What are the biggest risks when embedding analytics in business processes?
The most common failures involve multi-tenancy permission errors that expose data across customer segments, siloed datasets that produce incomplete views, and insufficient executive sponsorship. Technology accounts for only 30% of project success.
How long does it take to implement embedded analytics?
Implementation timelines vary by complexity, but organizations that follow a structured six-step framework and prioritize data governance typically reach their first production deployment within three to six months.
Can non-technical users benefit from embedded analytics?
Yes. Generative BI tools enable natural language queries so operational users can ask business questions directly without SQL knowledge, significantly widening analytics adoption beyond data teams.