TL;DR:
- A data-driven decision making workflow is a structured process that transforms raw data into governed, accountable decisions with full traceability. Most organizations struggle to convert insights into repeatable decisions and must integrate analytics tools, policy engines, and measurement stages to ensure reliability and compliance. Building and documenting a workflow enables organizations to adapt to increasing regulatory pressures and operational complexity effectively.
A data-driven decision making workflow is a structured, repeatable process that transforms raw data into governed, measurable business decisions, connecting analytics output to operational execution with full auditability. Most enterprises generate substantial analytical insight but fail at the critical step of converting that insight into consistent, accountable decisions. Mastering this workflow means building the cognitive backbone that links Tableau dashboards, Power BI reports, and policy engines into a single, traceable decision pipeline. In 2026, with regulatory pressure on data governance intensifying and AI/ML operationalization accelerating, the difference between organizations that outperform peers and those that stagnate comes down to whether their analytics infrastructure actually drives decisions, or merely informs conversations.
What are the core stages of a data-driven decision making workflow?
A sustainable workflow consists of six to eight sequential stages, and skipping any one of them measurably weakens the reliability of operational decisions. This is not a theoretical concern. Organizations that compress or bypass stages routinely produce decisions that cannot be reproduced, audited, or improved because the logic behind them was never captured.
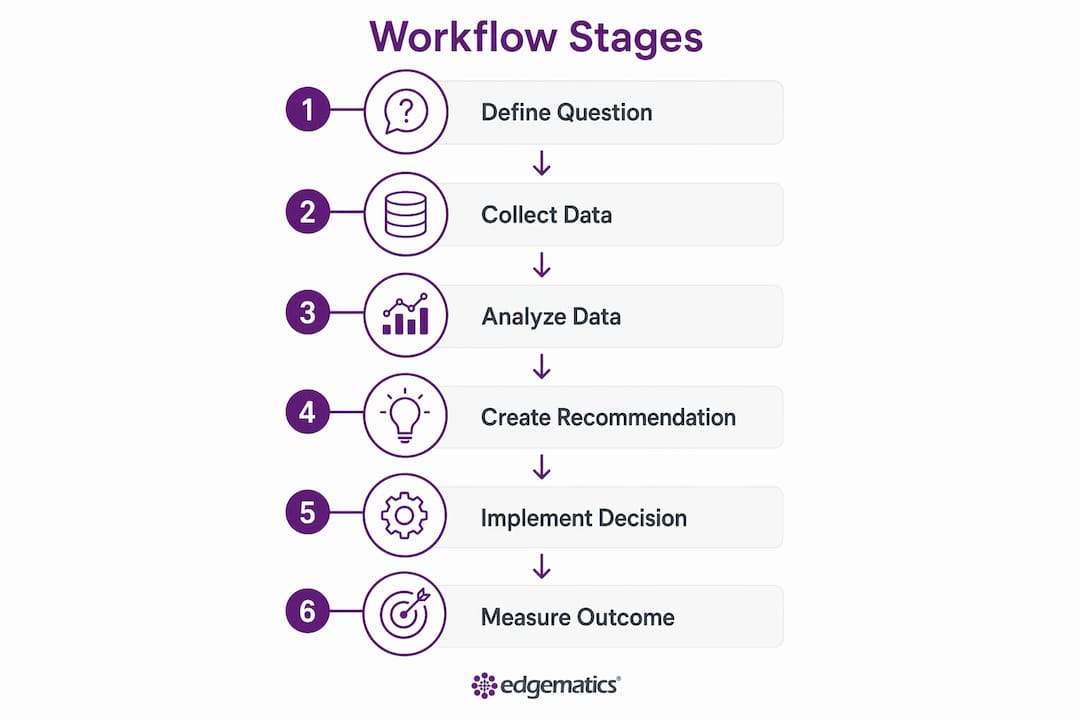
The stages, in order, are:
- Define the business question: Every workflow begins with a precise, answerable question tied to a measurable outcome. Vague questions produce vague decisions.
- Identify and catalog data sources: Map internal systems (CRM, ERP, data warehouses) and external feeds (market data, regulatory databases) before touching a single dataset.
- Clean and validate data: Establish data quality thresholds and document every transformation. Trust in the decision depends entirely on trust in the data.
- Conduct structured analysis: Apply statistical models, machine learning outputs, or BI queries against validated data. This is where Tableau, Power BI, and Looker earn their place.
- Translate insight into a decision recommendation: Convert analytical output into a specific, documented recommendation with a named owner and a defined decision threshold.
- Execute and document the decision: Record the decision, the data that supported it, the policy rules applied, and the expected outcome. Treat the decision as a first-class artifact.
- Measure outcomes and iterate: Compare actual results against expected outcomes. Feed discrepancies back into data sources, models, and policy logic.
The table below summarizes each stage with its primary activity and the function responsible.
| Stage | Primary activity | Responsible function |
|---|---|---|
| Define business question | Frame the decision problem with success criteria | Business leadership |
| Identify data sources | Catalog internal and external datasets | Data engineering |
| Clean and validate | Apply quality rules and document transformations | Data operations |
| Structured analysis | Run models and BI queries against clean data | Analytics and data science |
| Insight translation | Produce a documented decision recommendation | Analytics and business owner |
| Execute and document | Record decision logic, policy rules, and expected outcome | Decision owner and governance |
| Measure and iterate | Compare outcomes to expectations and update models | Analytics and operations |
How to select and integrate tools for your decision workflow
Tool selection is not about picking the most popular platform. It is about matching each tool’s capability to a specific stage in your analytics-based decision process, then connecting those tools so data flows from input to outcome without manual handoffs breaking the chain.
The core tool categories every enterprise decision workflow requires are:
- BI and visualization platforms: Tableau, Power BI, and Looker each serve the analysis and insight translation stages. Tableau excels at exploratory visual analysis; Power BI integrates tightly with Microsoft Azure ecosystems; Looker provides governed, version-controlled metrics through LookML.
- Policy engines: Integrating policy engines that enforce business rules alongside analytics models is not optional for regulated industries. Policy engines act as safety layers that govern decision outputs before execution, separating compliance logic from model logic so each can be updated independently.
- Observability and telemetry tools: Observable decision pipelines operationalize analytics into automated decisions with auditability, feature stores, and continuous improvement loops. Tools like Monte Carlo, Datafold, and custom telemetry layers track data quality and decision outcomes in real time.
- Version control and approval workflows: Git-based versioning for decision logic, combined with approval gates in platforms like Apache Airflow or Prefect, creates the governance layer that regulated industries require.
Step-by-step implementation of a data-driven decision process
Operationalizing an evidence-based decision workflow requires more than technology. It requires defined roles, documented processes, and a culture that grades teams on decision outcomes, not just insight production. Here is how to implement it in practice.
- Define measurable business objectives and success criteria: Before collecting a single data point, specify what a good decision looks like. A credit risk team, for example, should define acceptable false positive rates and revenue impact thresholds before building any model.
- Select three to five key metrics: Focus on three to five metrics that directly impact revenue and engagement. Tracking more than five at the workflow level creates noise and dilutes accountability. Each metric must have a named owner.
- Collect and validate relevant data sources: Pull from internal systems and external sources, then apply documented validation rules. Every dataset entering the workflow must pass a quality gate before analysis begins. Undocumented datasets are a governance liability.
- Apply data cleaning and trust-building practices: Use automated data quality tools to flag anomalies, duplicates, and schema drift. Document every transformation in a data catalog, so downstream consumers know exactly what they are working with.
- Translate analysis into a documented decision recommendation: The output of your analytics stage is not a chart. It is a written recommendation that specifies the decision, the data supporting it, the confidence level, and the named decision owner. This is what makes the decision auditable.
- Manage execution with automation, approvals, and policy enforcement: Automate high-frequency, low-risk decisions through your policy engine. Route high-stakes or novel decisions through a human-in-the-loop approval gate. Real-time dashboards and alerts empower leaders to act faster than conventional periodic reports, which is critical when market conditions shift mid-cycle.
- Measure decision impact and iterate: Compare actual outcomes against the success criteria defined in step one. Feed discrepancies back into your data models, policy rules, and training datasets. This iteration loop is what separates a living decision workflow from a static dashboard trap.
Common challenges in data-driven decision making workflows
Even well-designed workflows encounter predictable failure points. Knowing them in advance lets you build defenses before they become crises.
Organizational silos prevent the cross-functional data sharing that decision workflows depend on. Finance, operations, and product teams often maintain separate data stores with incompatible definitions. A governed data engineering layer that creates shared, trusted datasets is the structural solution.
Unclear decision ownership is the silent killer of analytics programs. Most organizations never build the decision layer that turns insights into consistent, governable decisions, and the primary reason is that no one is formally accountable for decision outcomes. Grading analytics teams on decision quality, not report volume, shifts this dynamic.
The static dashboard trap is a pattern where teams invest heavily in visualization but never automate or document the decisions those visualizations are meant to support. A dashboard that no one acts on is an expensive report.
Key takeaways
A data-driven decision making workflow succeeds only when every stage from problem definition to outcome measurement is executed, documented, and governed as a connected system.
Why decision integration is the layer most enterprises are missing
We have worked with enterprise data teams across healthcare, finance, and operations, and the pattern is consistent. Teams are not failing at analytics. They are failing at the step that comes after analytics: turning a well-built insight into a repeatable, governed, accountable decision.
The uncomfortable reality is that most analytics programs are graded on output, not outcomes. A team that publishes twelve dashboards per quarter looks productive. A team that drives three measurable business decisions with documented impact looks smaller on paper but delivers more value. Shifting that grading system is a leadership decision, not a technology decision.
We also see organizations underestimate the governance dimension of decision workflows. In 2026, regulators in financial services, healthcare, and data-sensitive industries are increasingly asking not just “what decision did you make?” but “why did you make it, what data supported it, and can you reproduce it?” Treating decisions as versioned, auditable artifacts within a CI/CD-style pipeline is no longer a best practice reserved for the most sophisticated teams. It is becoming a compliance baseline.
Our advice to enterprise leaders: start with one decision workflow, build it correctly with documentation, policy enforcement, and outcome measurement, and use it as the template for scaling. The organizations that build this foundation now will be significantly better positioned when regulatory and operational demands intensify further.
How Edgematics supports enterprise decision workflows
Edgematics builds the infrastructure that connects your data to your decisions. Our data strategy consulting helps enterprise teams define measurable objectives, identify the right data sources, and design workflows that are governed from day one. Our data engineering and governance practice constructs the trusted pipelines and decision automation frameworks that regulated industries require. For organizations ready to move from insight generation to decision integration, we provide AI-powered orchestration, policy engine implementation, and continuous outcome measurement. If you are building or scaling a decision workflow and want an architecture that holds up under compliance scrutiny, let’s talk.
FAQ
What is a data-driven decision making workflow?
A data-driven decision making workflow is a structured, sequential process that moves from defining a business question through data collection, analysis, decision execution, and outcome measurement. It treats each decision as a documented, auditable artifact rather than an informal judgment.
How is data-driven different from data-informed decision making?
Data-driven decisions rely primarily on quantitative metrics for clear operational choices, while data-informed decisions combine data with contextual judgment for strategic situations. Distinguishing the two prevents false precision in complex decisions.
How many metrics should a decision workflow track?
Effective workflows focus on three to five metrics that directly connect to revenue or engagement outcomes. Tracking more than five dilutes accountability and makes it harder to attribute decision outcomes to specific inputs.
What role do policy engines play in a decision workflow?
Policy engines enforce business rules and compliance requirements alongside analytics models, acting as a governance layer that governs decision outputs before execution. They allow compliance logic to be updated independently from model logic, which is critical for regulated industries.
What is decision shadowing and why does it matter?
Decision shadowing runs new decision logic in parallel with existing logic in a production environment without affecting users, allowing teams to validate outputs before full promotion. It is the safest method for rolling out changes to high-stakes decision workflows.